This Action Project focuses on prevention-based models to address housing and homelessness inequities that persist in MetroWest. The goal is to provide paths to safe, stable, and permanent housing for under-resourced residents.
Housing is the key to reducing intergenerational poverty and an important factor in increasing economic mobility and addressing community safety and wellbeing. For many decades, zoning barriers, insufficient affordable housing development, and population growth have created a complex and multifaceted housing problem in the Commonwealth. As a result, we have an affordability crisis, a supply and demand imbalance, and, most critically, an increasing homelessness crisis. To put the homelessness crisis into perspective, from 2020-2023, 3,141 more people in families with children experienced homelessness in Massachusetts, more than any other state in the U.S.
In MetroWest specifically, root causes such as rising rents in our dense population hubs of Framingham, Waltham, and Milford, exponential increases in home prices in both wealth communities like Wellesley and middle-income communities like Medfield and Hopkinton, and a lack of available public transportation infrastructure in Marlborough contribute to a complex housing system that requires a multilayered solution.
To understand the complex problem more fully, Impact MetroWest data indicators show many disparities across racial and ethnic lines. Here are some key statistics related to Housing and Homelessness Prevention:
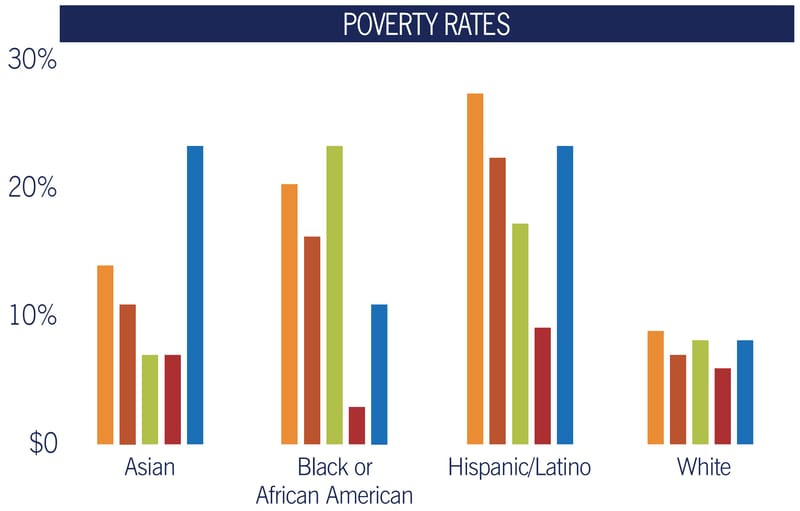
- 8% of Massachusetts residents live in poverty, but in MetroWest, the disparities fall along racial and ethnic lines.
- 14% of black residents in MetroWest live in poverty while 19% of Hispanic residents live in poverty.
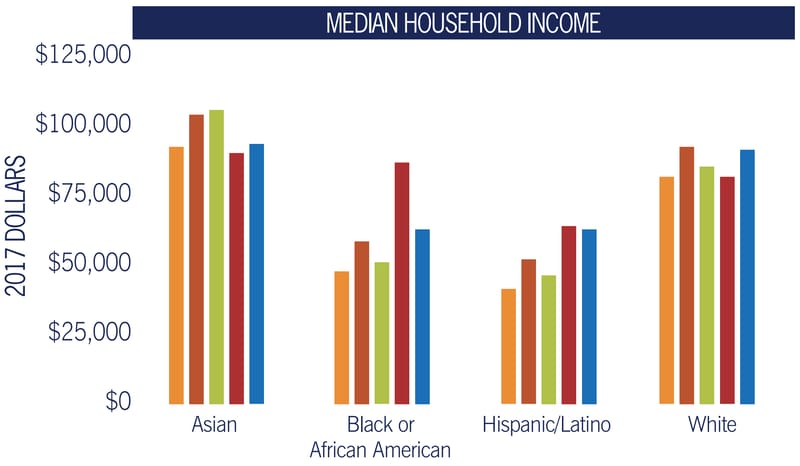
- Median household income in MetroWest also sees sharp differences along racial and ethnic lines. From 2016-2020, white resident incomes averaged $100k, while black resident incomes averaged $66k and Hispanic resident incomes averaged $60k.
- An important driver of homelessness is the high cost of living in MetroWest. A family with one earning adult and two dependent children must earn $49/hour to adequately pay for food, shelter, and other basic needs.
- An important cost of living indicator is the percentage of income spent on rent where 30% is the national standard for affordability. Hispanics in MetroWest pay 35% of income on rent on average.
Successful prevention-based solutions to housing issues are well documented, but difficult or expensive to maintain and balance with the pressing and crisis-oriented needs that continue to exist. The Department of Housing and Urban Development identified several strategies including blending supportive services for individuals and families with access to permanent housing as well as a focus on mediation in Housing Courts. The Housing First philosophy which prioritizes permanent supportive housing and rapid re-housing has been a well-documented model in Massachusetts.
We believe that government solutions are essential to tackling housing and homelessness prevention, but that philanthropy must play an important part in prioritizing housing and homelessness prevention as a significant and strategic investment.
In our community, and through the new MetroWest Homelessness Prevention Action Project, we will invest in a multilayered solution that combines effective and direct strategies to prevent homelessness with coalition building and sustainable collaboration across the sector.